Göstergeler
Topluluk üyelerinin CodeScript ile yazdığı göstergeler ve stratejiler burada yer alır. Açık kodlu yayınları inceleyebilir, dilediğinizi tek tıkla grafiğinize ekleyebilirsiniz.
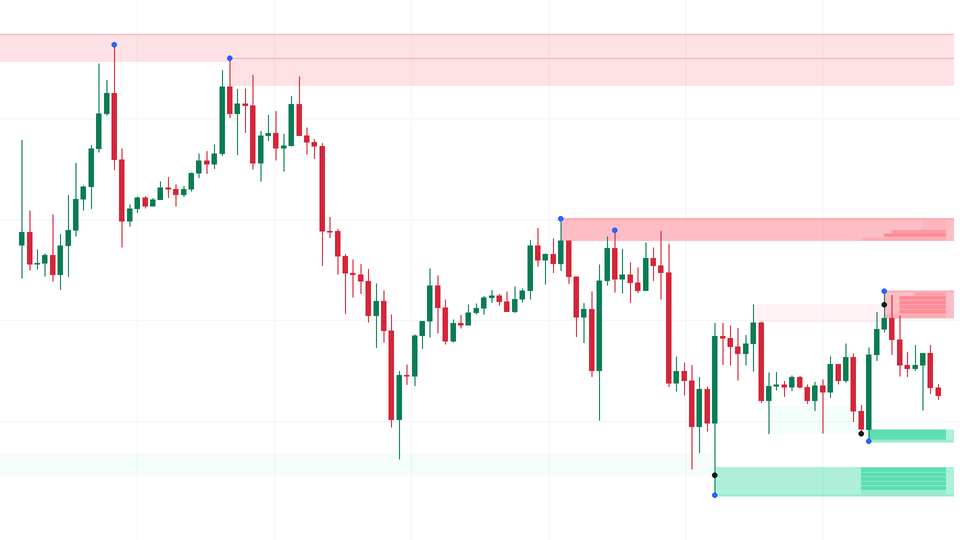
Liquidity Clusters
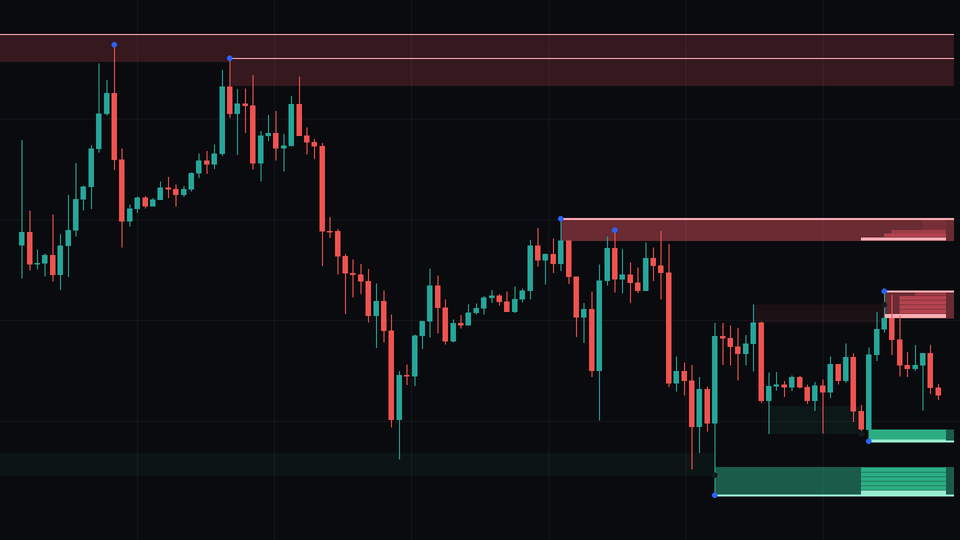
Builds support and resistance from swing highs and lows that held more than once, and tracks how breaks of them end on this symbol.
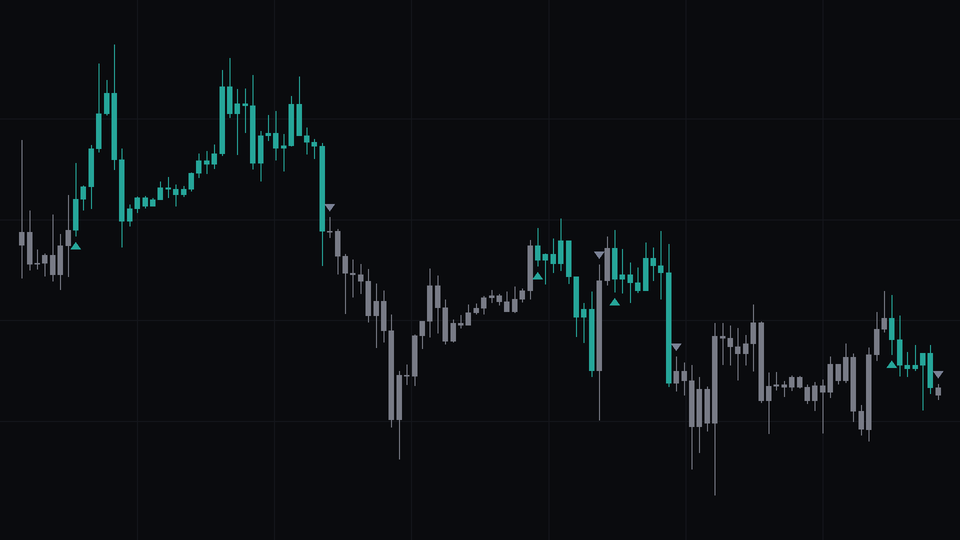
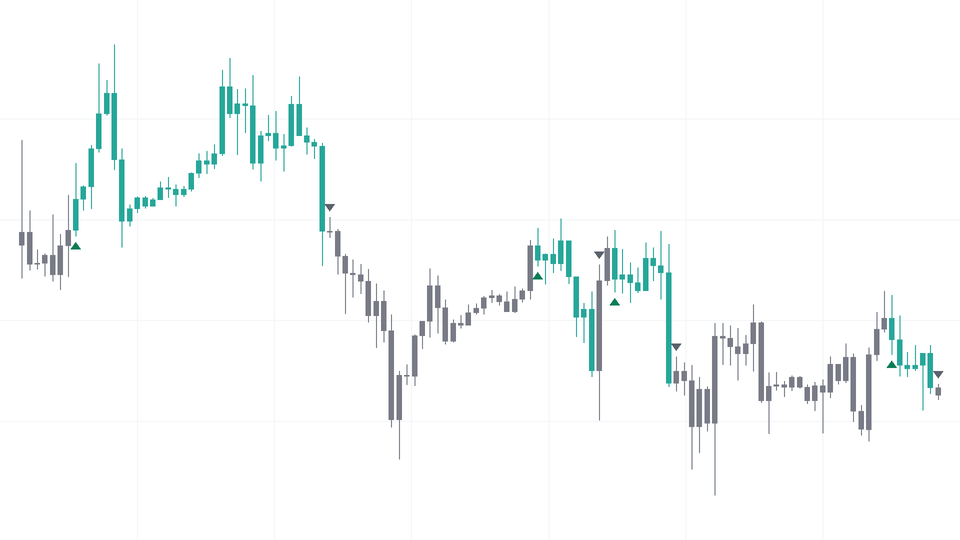
EMA Cross
A moving average crossover strategy with commission and slippage set to realistic values.
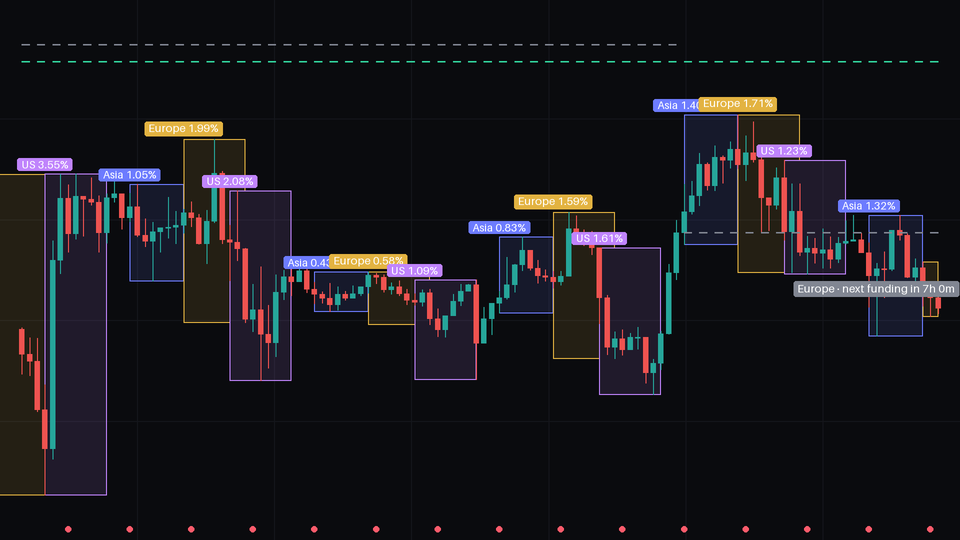
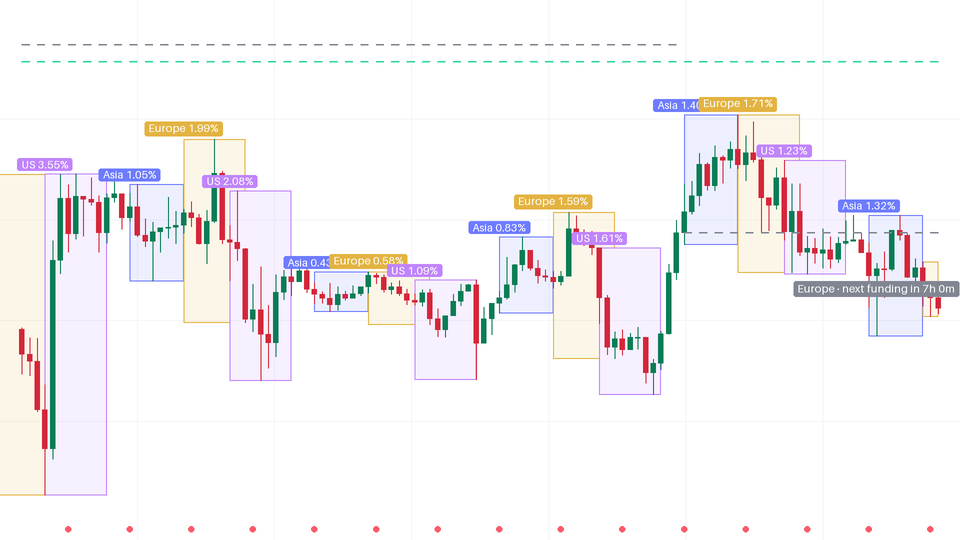
Session Ranges
Draws the Asia, Europe and US sessions as range boxes, with weekly and monthly opens and funding times, using Crypto Calendar.
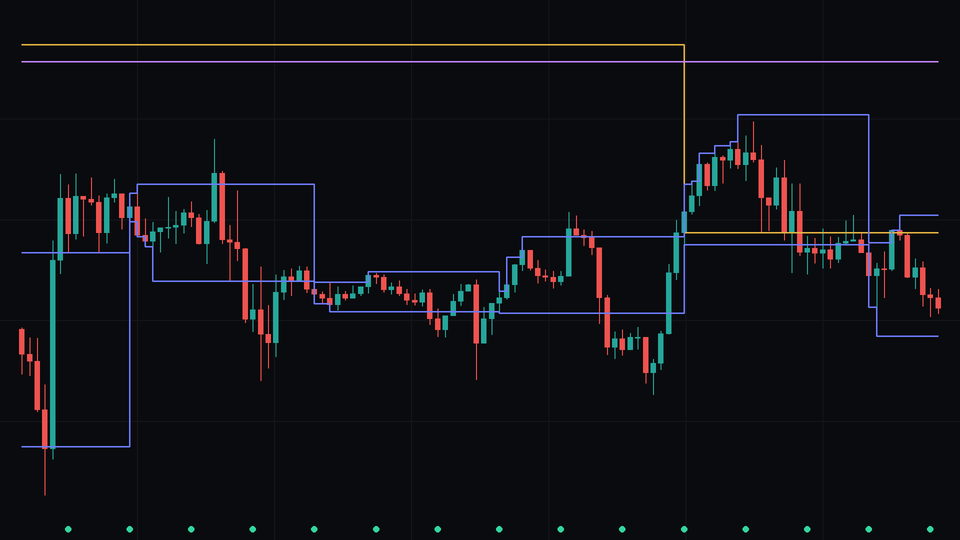
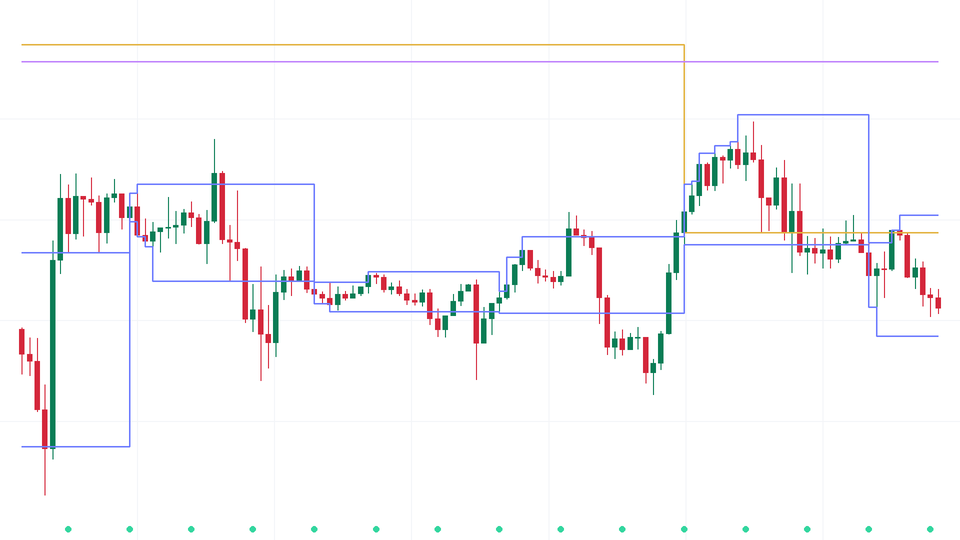
CryptoCalendar
Funding times and countdown, UTC trading sessions, daily, weekly and monthly opens, and session highs and lows for your own scripts.
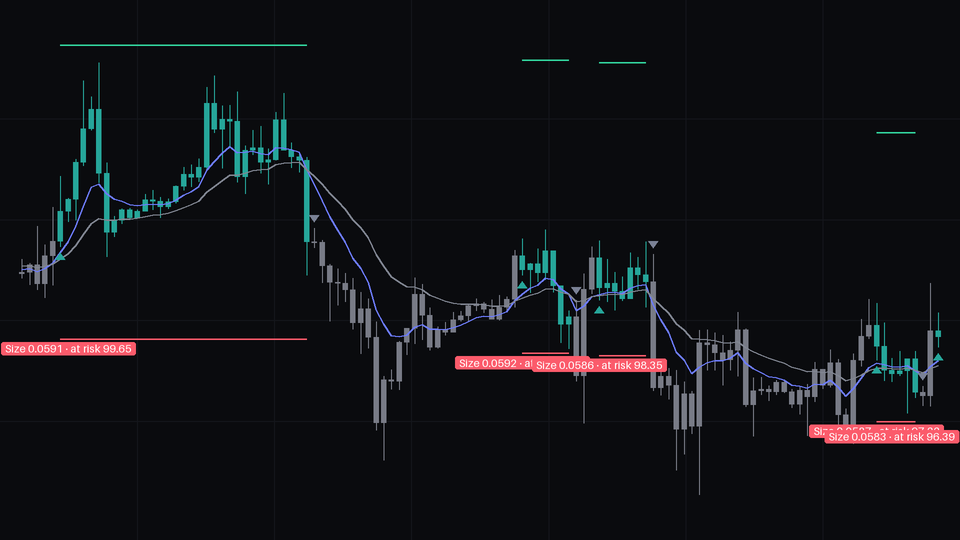
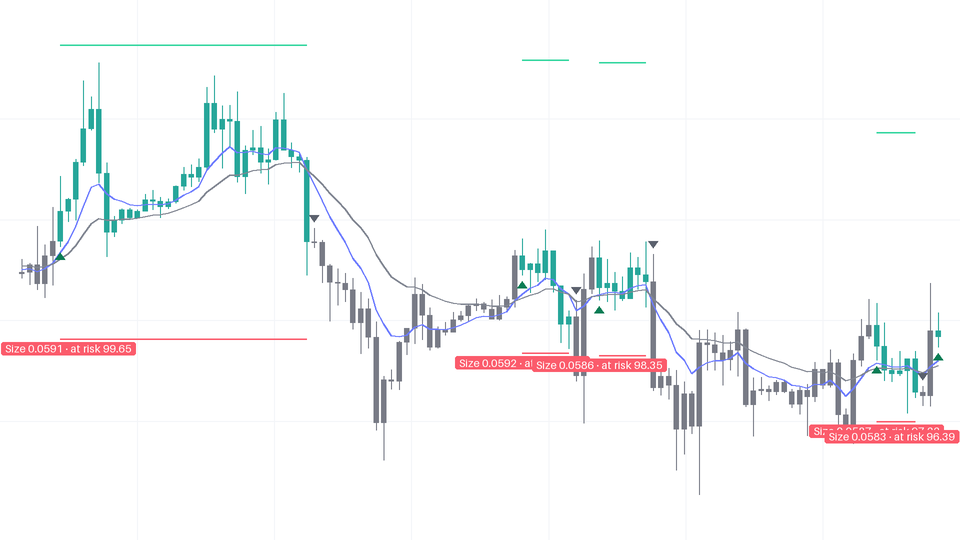
EMA Cross Risk
The EMA crossover strategy sized by risk: each trade loses the same share of equity at its stop, using Position Kit.
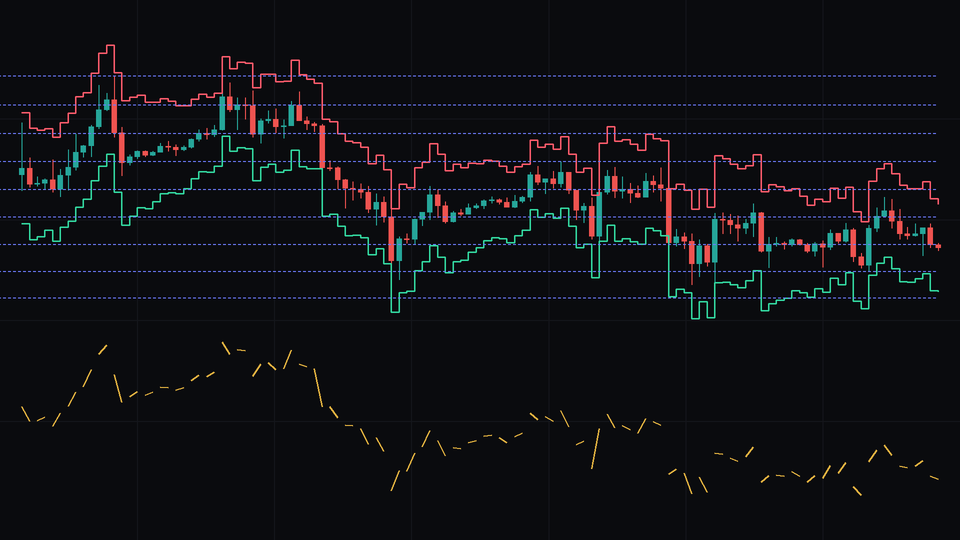
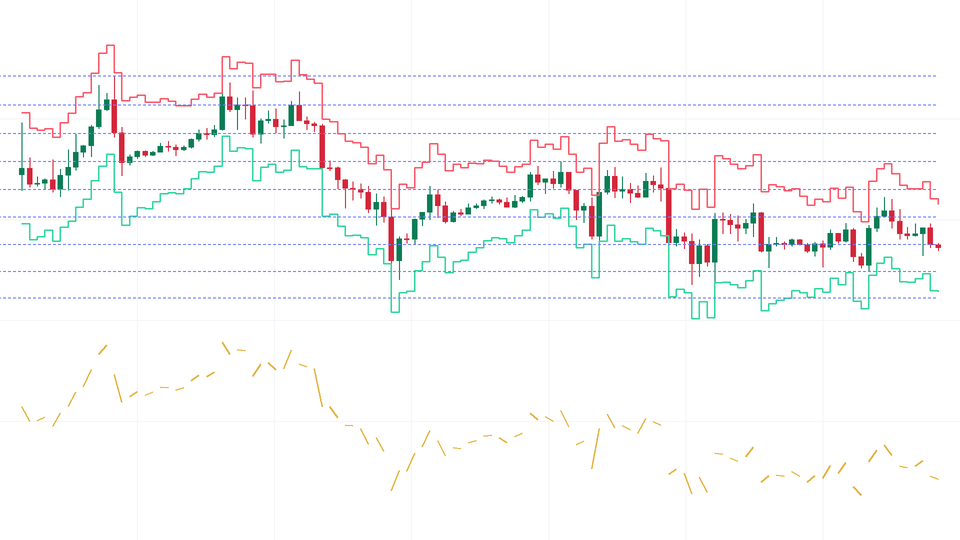
PositionKit
Position sizing by risk, ATR stops, margin and liquidation estimates, Grid Bot levels and price rounding for your own scripts.
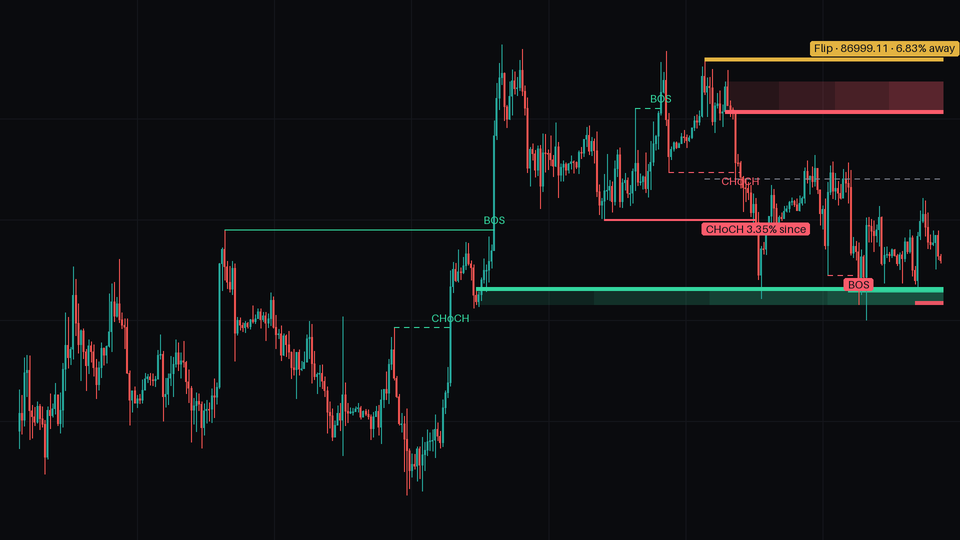
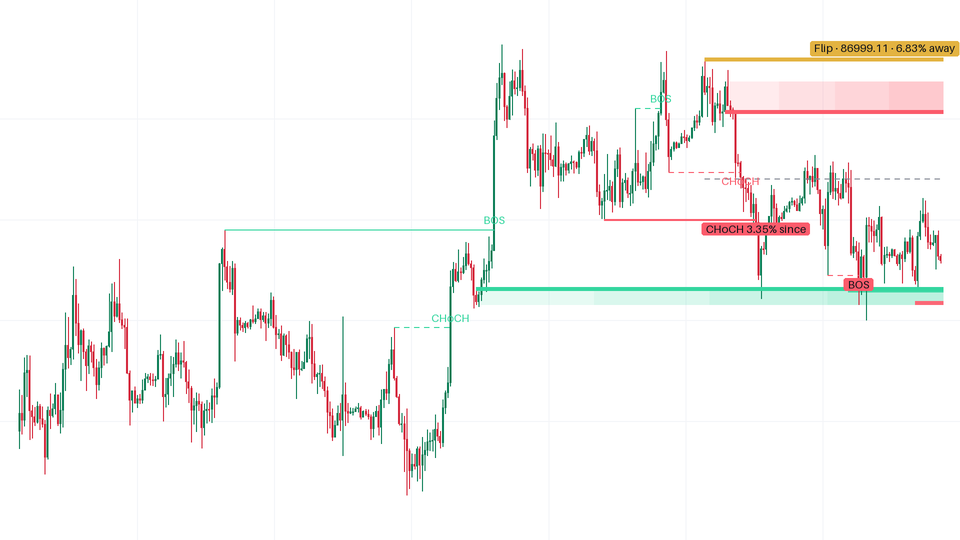
Structure Compass
Reads market structure on two scales: direction, break strength, the level that would flip it, and where price sits in the range.
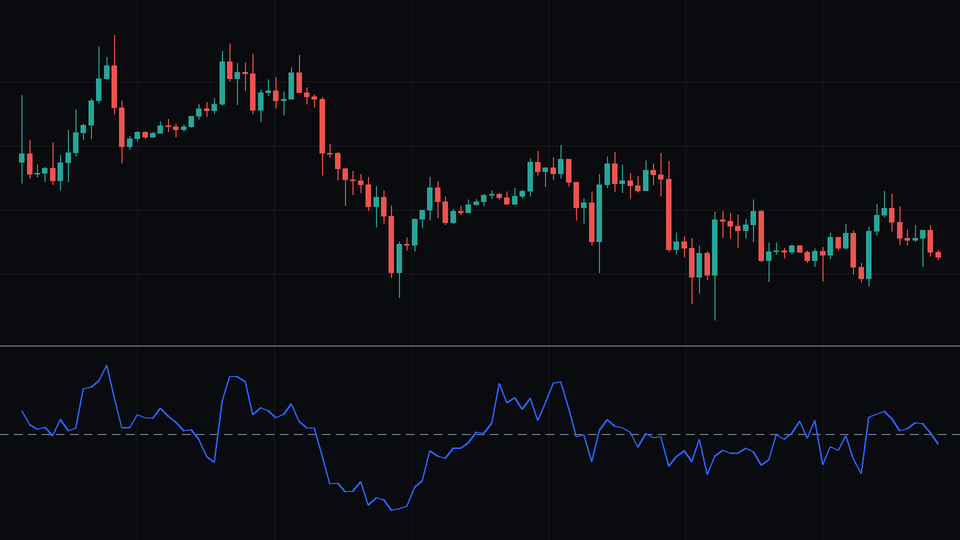
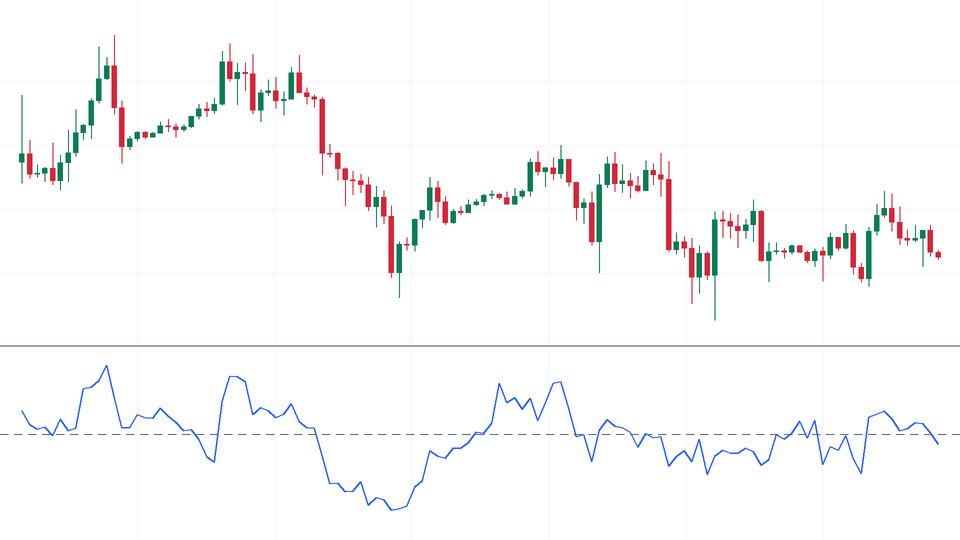
Trend Strength
Compares the average size of up moves with down moves, on a scale from -100 to 100.
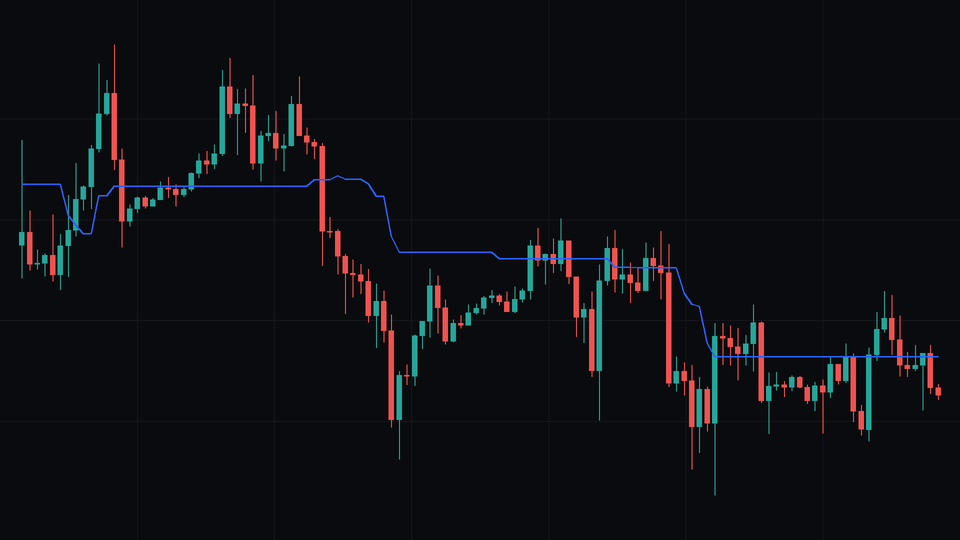
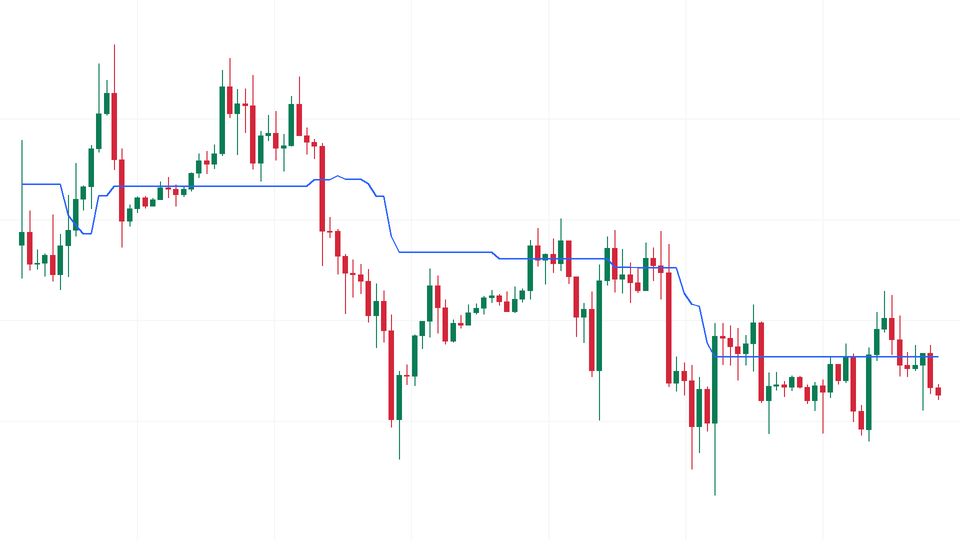
Range Midline
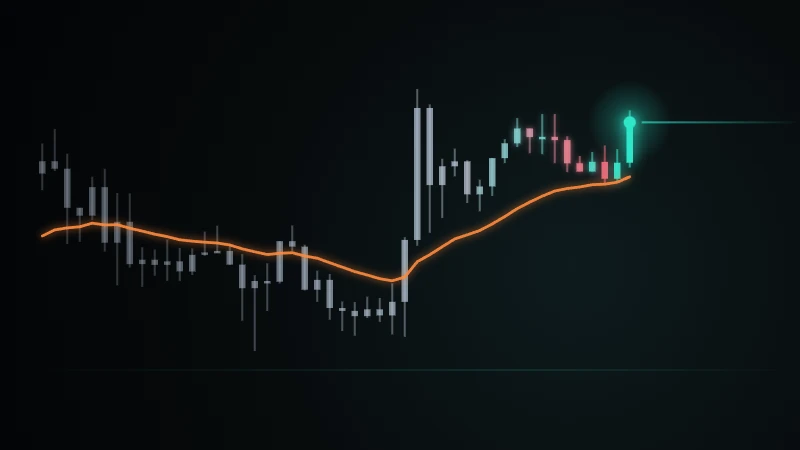
A single line halfway between the highest high and the lowest low of the lookback window.
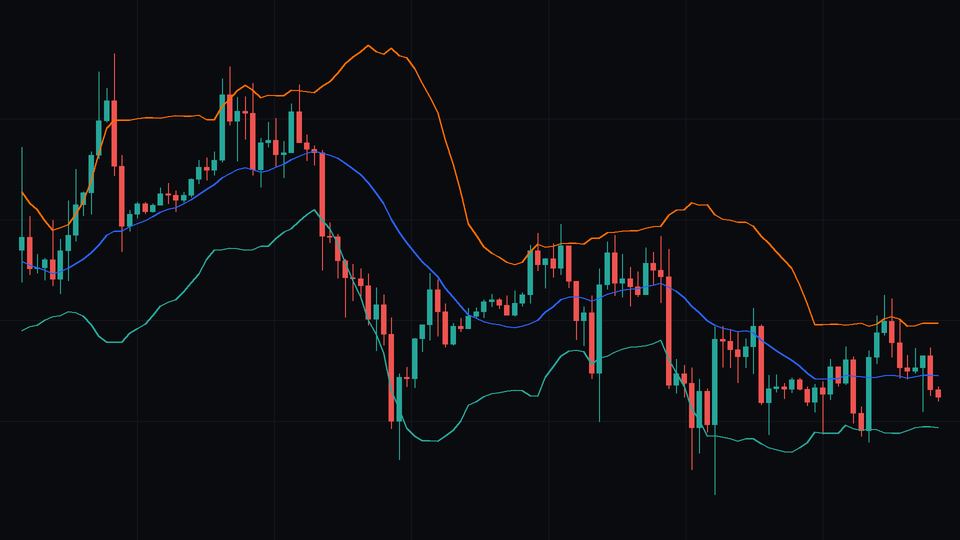
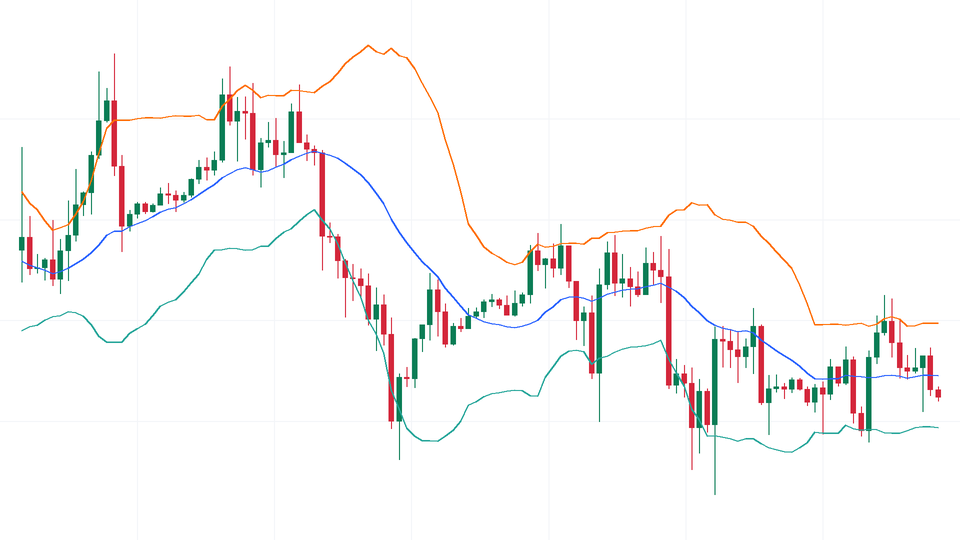
Deviation Band
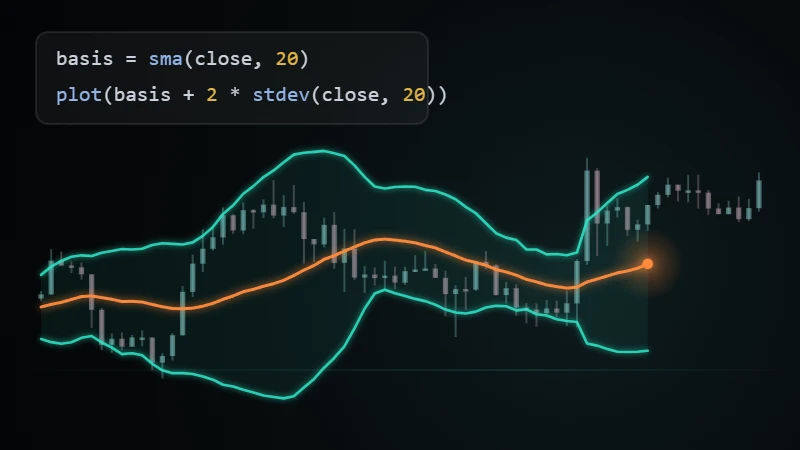
A band around the 20-bar average that widens and narrows with the standard deviation of price.