EMA Cross Risk
The EMA crossover strategy sized by risk: each trade loses the same share of equity at its stop, using Position Kit.
EMA Cross Risk is the EMA Cross strategy with one change that matters more than the signal itself: every trade is sized so that, if its stop is hit, it loses the same share of the account. The sizing comes from Position Kit, and the size written on the chart is the size the strategy tester opens.
How it works
A long position opens on the bar after the fast EMA crosses above the slow EMA. It closes at whichever comes first: the stop, the target, or the fast EMA crossing back below the slow one.
The stop sits a fixed percentage below the entry, and the target a set multiple of that distance above it. Because the stop distance is a fixed percentage, risk-based sizing becomes a fixed share of equity: risk per trade divided by stop distance. With the default settings, 1% ÷ 2% = 50% of equity per trade, and a trade stopped out loses 1% of equity before costs.
On the signal bar, Position Kit builds a plan from the current equity and the close, and the order is sent with that size. The label under the entry shows the size of the plan and the amount at risk; it is the same quantity the strategy tester traded.
Commission (0.1% per side) and slippage (0.05%) are included, so that the test results are not more favourable than real trading would be.
Reading the chart
Hover over an item below to see it on the chart.
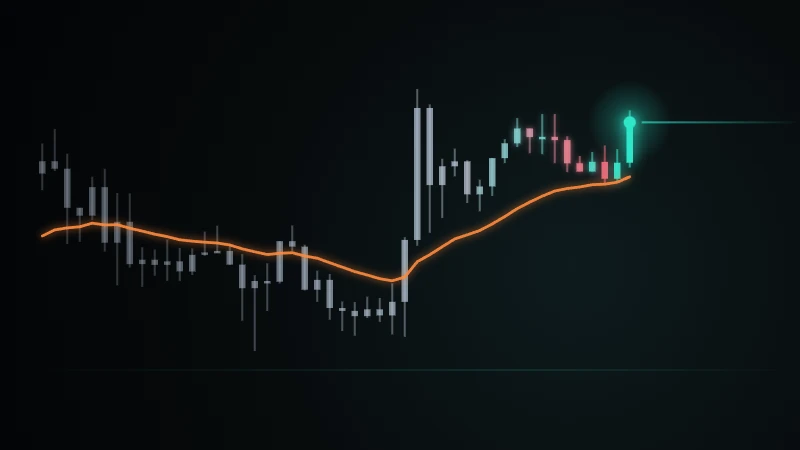
- Blue line: the fast EMA, 9 bars by default.
- Grey line: the slow EMA, 21 bars by default.
- Red line and label: the stop of the open trade. The label on the entry bar gives the size in units of the base asset and the amount at risk in the quote currency.
- Green line: the target of the open trade.
Settings
- Fast EMA
- 9
- Length of the fast moving average.
- Slow EMA
- 21
- Length of the slow moving average.
- Risk per trade (%)
- 1
- The share of equity lost if the stop is hit, before commission and slippage.
- Stop distance (%)
- 2
- How far below the entry the stop is placed.
- Target (x risk)
- 2
- The target distance as a multiple of the stop distance.
The sizing in the code
Each order carries its own size. The plan is calculated on the signal bar and passed to enterLong as qty, so the size follows the account from one trade to the next.
plan = pk.planFor(equity(), riskPct < stopPct ? riskPct : stopPct, close, close * (1 - stopPct / 100), rr)
enterLong(signal, qty = plan.qty, stopLoss = stopPct, takeProfit = stopPct * rr)Limits and points to note
- Risk per trade cannot exceed the stop distance: above that, the position would need more than the whole account. Size is capped at 100% of equity, and the actual risk is then the stop distance. Leverage is not used.
- The size is set at the close of the signal bar and the order fills at the next bar's open. If the open is different, the amount at risk changes by the same proportion.
- The stop is a fixed percentage, not a volatility stop. In a quiet market it may be wide; in an active one, ordinary movement can reach it.
- On a price gap or a fast bar, the fill can be worse than the stop, so a single loss can be larger than the chosen risk.
- Moving average crossovers react after a move has started and give back part of it before the exit. The strategy only takes long trades.
- Test results describe the past. They are not a forecast and do not indicate future results.
EMA Cross Risk, EMA Cross stratejisinin sinyalden daha önemli tek bir değişiklik yapılmış hâlidir: her işlem, zarar-durduru çalışırsa hesabın aynı payını kaybettirecek büyüklükte açılır. Boyutlandırma Position Kit'ten gelir ve grafikte yazan büyüklük, strateji sınamasının açtığı büyüklüktür.
Nasıl çalışır
Hızlı EMA yavaş EMA'yı yukarı kestiğinde bir sonraki barda long pozisyon açılır. Pozisyon zarar-durdur, kâr-al ya da hızlı EMA'nın yavaş EMA'yı aşağı kesmesinden hangisi önce gelirse onunla kapanır.
Zarar-durdur girişin sabit bir yüzde altında, kâr-al seviyesi ise bu mesafenin belirli bir katı üstünde durur. Zarar-durdur mesafesi sabit bir yüzde olduğu için riske göre boyutlandırma, sermayenin sabit bir payına dönüşür: işlem başına risk bölü zarar-durdur mesafesi. Varsayılan ayarlarla %1 ÷ %2 = işlem başına sermayenin %50'si olur ve zarar-durdurla kapanan bir işlem, maliyetler hariç sermayenin %1'ini kaybettirir.
Sinyal barında Position Kit, o anki sermaye ve kapanış fiyatıyla bir plan kurar ve emir bu büyüklükle gönderilir. Girişin altındaki etiket planın büyüklüğünü ve riske giren tutarı gösterir; bu büyüklük strateji sınamasının işlem yaptığı miktarla aynıdır.
Komisyon (her yön için %0,1) ve kayma (%0,05) hesaba katılır; böylece sınama sonuçları gerçek işlemden daha olumlu görünmez.
Grafiği okuma
Aşağıdaki bir maddenin üzerine geldiğinizde grafikte öne çıkar.
- Mavi çizgi: hızlı EMA, varsayılan 9 bar.
- Gri çizgi: yavaş EMA, varsayılan 21 bar.
- Kırmızı çizgi ve etiket: açık işlemin zarar-durduru. Giriş barındaki etiket, büyüklüğü ana varlık cinsinden, riske giren tutarı karşı para birimi cinsinden verir.
- Yeşil çizgi: açık işlemin kâr-al seviyesi.
Ayarlar
- Fast EMA
- 9
- Hızlı hareketli ortalamanın uzunluğu.
- Slow EMA
- 21
- Yavaş hareketli ortalamanın uzunluğu.
- Risk per trade (%)
- 1
- Zarar-durdur çalışırsa kaybedilen sermaye payı; komisyon ve kayma hariç.
- Stop distance (%)
- 2
- Zarar-durdurun girişin ne kadar altına konduğu.
- Target (x risk)
- 2
- Kâr-al mesafesinin zarar-durdur mesafesine oranı.
Koddaki boyutlandırma
Her emir kendi büyüklüğünü taşır. Plan sinyal barında hesaplanır ve enterLong'a qty olarak verilir; böylece büyüklük işlemden işleme hesabı izler.
plan = pk.planFor(equity(), riskPct < stopPct ? riskPct : stopPct, close, close * (1 - stopPct / 100), rr)
enterLong(signal, qty = plan.qty, stopLoss = stopPct, takeProfit = stopPct * rr)Sınırlar ve dikkat edilecekler
- İşlem başına risk zarar-durdur mesafesini aşamaz: bunun üstünde pozisyon hesabın tamamından fazlasını gerektirirdi. Büyüklük sermayenin %100'üyle sınırlanır ve gerçek risk o zaman zarar-durdur mesafesi olur. Kaldıraç kullanılmaz.
- Büyüklük sinyal barının kapanışında belirlenir, emir bir sonraki barın açılışında gerçekleşir. Açılış farklıysa riske giren tutar da aynı oranda değişir.
- Zarar-durdur oynaklığa göre değil, sabit bir yüzdeyle konur. Sakin piyasada geniş kalabilir; hareketli piyasada olağan dalgalanma ona ulaşabilir.
- Fiyat boşluğunda ya da hızlı bir barda gerçekleşme zarar-durdurdan kötü olabilir; bu durumda tek bir kayıp seçilen riskten büyük olur.
- Hareketli ortalama kesişimleri hareket başladıktan sonra tepki verir ve çıkıştan önce hareketin bir kısmını geri verir. Strateji yalnız long işlem açar.
- Sınama sonuçları geçmişi anlatır; bir öngörü değildir ve gelecekteki sonuçlara işaret etmez.
strategy("EMA Cross Risk", overlay = true)import MarkudaDev/PositionKit/1 as pk commission(0.1)slippage(0.05) fastLen = input.int(9, "Fast EMA", min = 2)slowLen = input.int(21, "Slow EMA", min = 3)riskPct = input.float(1, "Risk per trade (%)", min = 0.1, max = 5, step = 0.1)stopPct = input.float(2, "Stop distance (%)", min = 0.5, max = 20, step = 0.1)rr = input.float(2, "Target (x risk)", min = 0.5, max = 10, step = 0.5) fast = ema(close, fastLen)slow = ema(close, slowLen)
strategy("EMA Cross Risk", overlay = true)import MarkudaDev/PositionKit/1 as pk commission(0.1)slippage(0.05) fastLen = input.int(9, "Fast EMA", min = 2)slowLen = input.int(21, "Slow EMA", min = 3)riskPct = input.float(1, "Risk per trade (%)", min = 0.1, max = 5, step = 0.1)stopPct = input.float(2, "Stop distance (%)", min = 0.5, max = 20, step = 0.1)rr = input.float(2, "Target (x risk)", min = 0.5, max = 10, step = 0.5) fast = ema(close, fastLen)slow = ema(close, slowLen)plot(fast, "Fast EMA", "#6d7cff")plot(slow, "Slow EMA", "#818692") signal = crossover(fast, slow)plan = pk.planFor(equity(), riskPct < stopPct ? riskPct : stopPct, close, close * (1 - stopPct / 100), rr)enterLong(signal, qty = plan.qty, stopLoss = stopPct, takeProfit = stopPct * rr)exit(crossunder(fast, slow)) var float plannedQty = navar float plannedRisk = naif signal and position() == 0 { plannedQty := plan.qty plannedRisk := plan.riskAmount}inTrade = position() > 0entry = positionAvg()stopLine = entry * (1 - stopPct / 100)plot(inTrade ? stopLine : na, "Stop", "#fb5b6b")plot(inTrade ? entry * (1 + stopPct * rr / 100) : na, "Target", "#33d69f")if inTrade and not inTrade[1] { labelNew(stopLine, "Size " + formatNumber(pk.roundToStep(plannedQty, 0.0001), 4) + " · at risk " + formatNumber(plannedRisk, 2), barIndex, "#fb5b6b", style = "label_up")}
Version 220 Oct 2026Latest
Each trade's size now comes straight from the Position Kit plan on the signal bar (enterLong qty), so the size follows the account from one trade to the next. The repeated inputs inside sizeByEquity are gone and the settings are unchanged. Sizes stay close to version 1; the size is now set at the close of the signal bar rather than at the fill. Her işlemin büyüklüğü artık sinyal barındaki Position Kit planından doğrudan gelir (enterLong qty); böylece büyüklük işlemden işleme hesabı izler. sizeByEquity içinde tekrar eden girdiler kaldırıldı, ayarlar değişmedi. Büyüklükler sürüm 1'e yakın kalır; büyüklük artık gerçekleşen fiyat yerine sinyal barının kapanışında belirlenir.
Code changes10 lines added, 11 lines removed
… rr = input.float(2, "Target (x risk)", min = 0.5, max = 10, step = 0.5) - // The tester reads its sizing once, before the first bar, so the two inputs are repeated inside the call.- // Inputs with the same title are one setting: changing "Risk per trade" changes both places.- sizeByEquity(input.float(1, "Risk per trade (%)", min = 0.1, max = 5, step = 0.1) / input.float(2, "Stop distance (%)", min = 0.5, max = 20, step = 0.1) * 100)- fast = ema(close, fastLen) slow = ema(close, slowLen)… signal = crossover(fast, slow)- enterLong(signal, stopLoss = stopPct, takeProfit = stopPct * rr)+ plan = pk.planFor(equity(), riskPct < stopPct ? riskPct : stopPct, close, close * (1 - stopPct / 100), rr)+ enterLong(signal, qty = plan.qty, stopLoss = stopPct, takeProfit = stopPct * rr) exit(crossunder(fast, slow)) - var float signalEquity = na+ var float plannedQty = na+ var float plannedRisk = na if signal and position() == 0 {- signalEquity := equity()+ plannedQty := plan.qty+ plannedRisk := plan.riskAmount } inTrade = position() > 0 entry = positionAvg()- plan = pk.planFor(signalEquity, riskPct < stopPct ? riskPct : stopPct, entry, entry * (1 - stopPct / 100), rr)- plot(inTrade ? plan.stop : na, "Stop", "#fb5b6b")- plot(inTrade ? plan.target : na, "Target", "#33d69f")+ stopLine = entry * (1 - stopPct / 100)+ plot(inTrade ? stopLine : na, "Stop", "#fb5b6b")+ plot(inTrade ? entry * (1 + stopPct * rr / 100) : na, "Target", "#33d69f") if inTrade and not inTrade[1] {- labelNew(plan.stop, "Size " + formatNumber(pk.roundToStep(plan.qty, 0.0001), 4) + " · at risk " + formatNumber(plan.riskAmount, 2), barIndex, "#fb5b6b", style = "label_up")+ labelNew(stopLine, "Size " + formatNumber(pk.roundToStep(plannedQty, 0.0001), 4) + " · at risk " + formatNumber(plannedRisk, 2), barIndex, "#fb5b6b", style = "label_up") }
Version 119 Oct 2026
First release
There are no community posts about this strategy yet. You can write the first post about it.