The whole market at a glance.
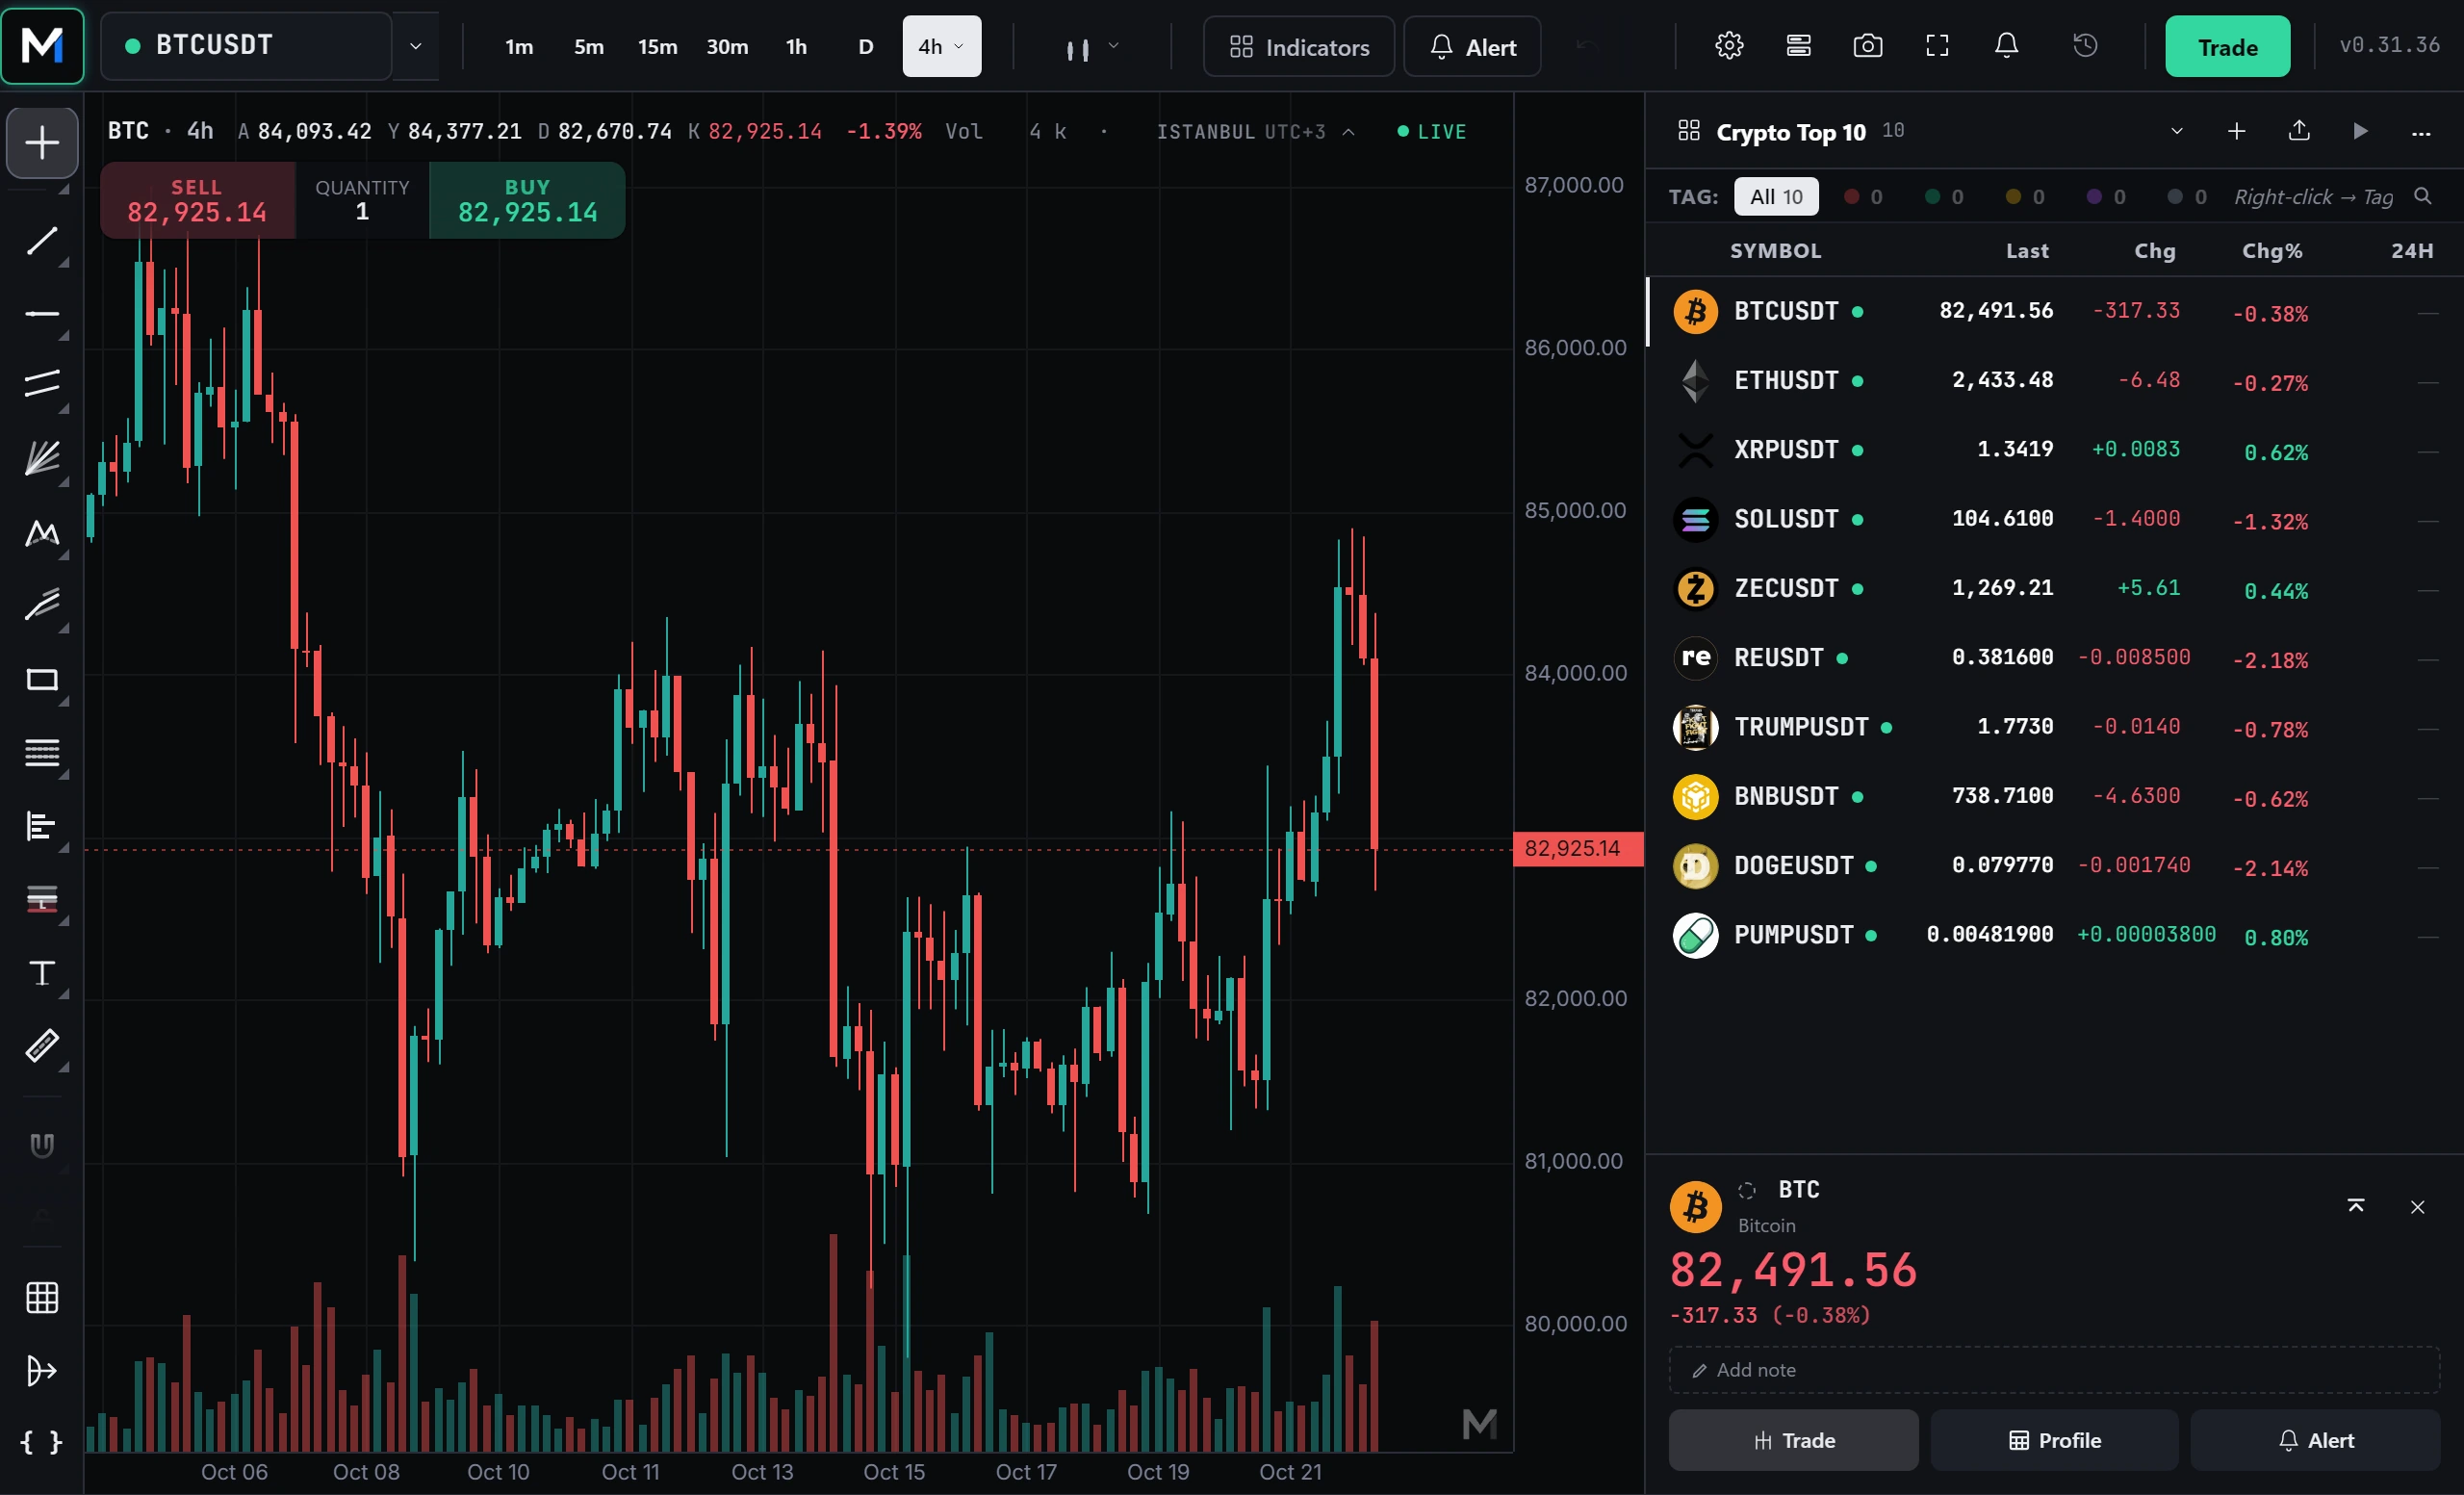
Follow hundreds of cryptocurrencies live at once, then see every detail up close when you focus on one.
Get startedThe picture behind the price.
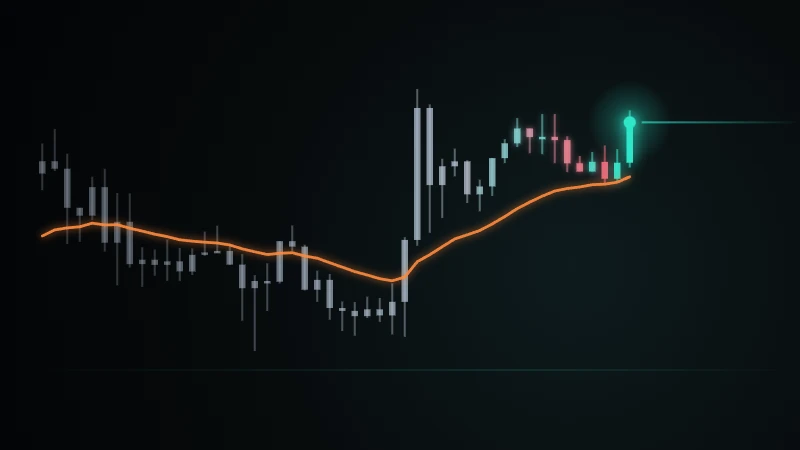
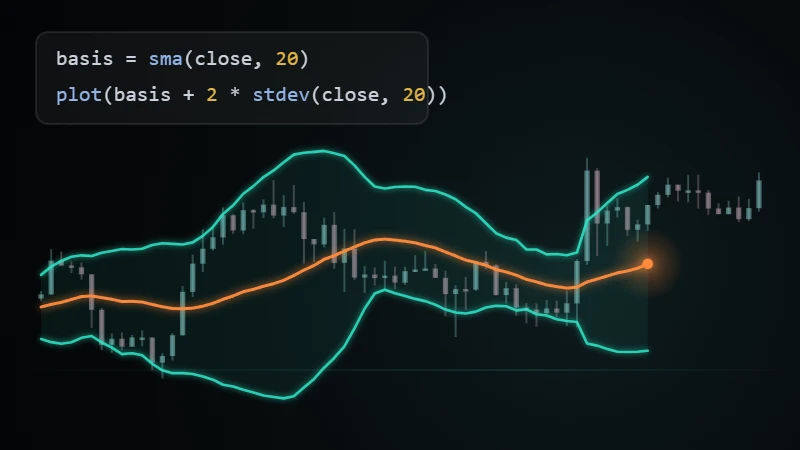
The colored areas on the chart show where price changed direction and where most of the buying and selling took place, all drawn by an indicator written in CodeScript.