Deviation Band
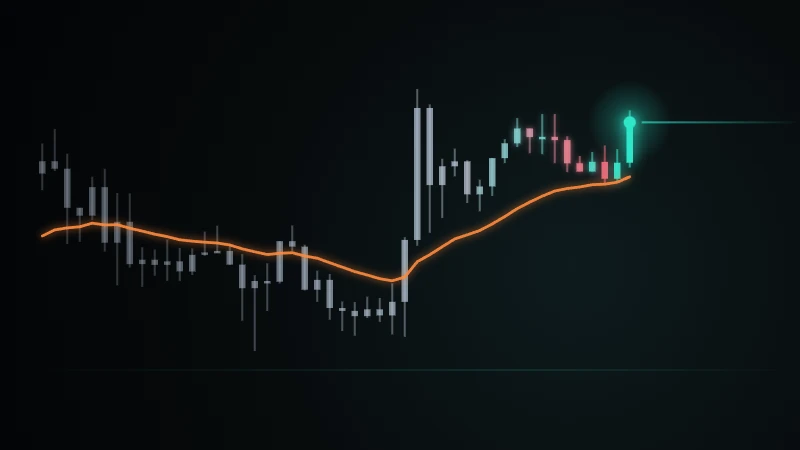
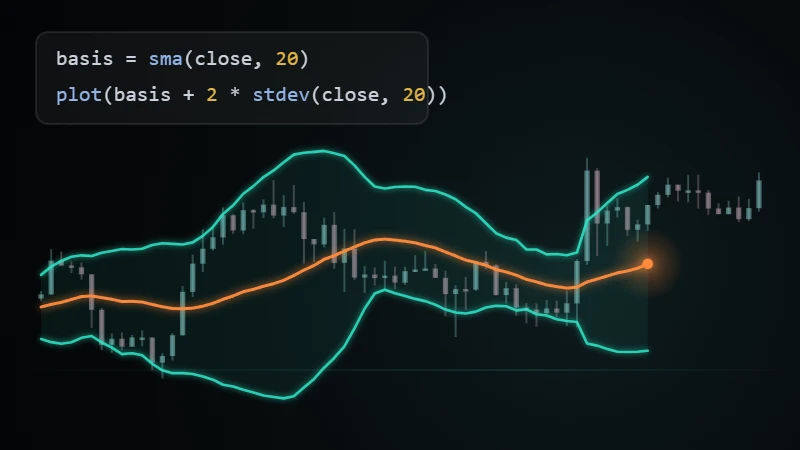
A band around the 20-bar average that widens and narrows with the standard deviation of price.
Deviation Band answers one question on every bar: how far has price moved from its recent average, compared with how much it normally moves? The band widens when price swings and narrows when it settles, so the same distance from the average reads as large in a quiet market and as ordinary in an active one.
How it works
The middle line is the simple moving average of the last 20 closes. The upper and lower lines are placed two standard deviations above and below it. The standard deviation measures how widely the same 20 closes are spread around their average.
Because the width comes from price itself, the band needs no fixed percentage. When price moves in a narrow range, the closes sit near their average and the band tightens; a sudden move spreads the closes out and the band opens up within a few bars.
If prices were spread evenly around their average, about 95% of closes would fall inside a two-deviation band. Crypto prices move in bursts, so more closes fall outside in practice: on BTCUSDT 4h, 131 of the last 1,000 closes finished beyond one of the two lines.
Reading the chart
Hover over an item below to see it on the chart.
- Blue line: the middle of the band, the 20-bar simple average.
- Orange line: the upper edge, two standard deviations above the average.
- Green line: the lower edge, two standard deviations below the average.
Settings
- Length
- 20
- The number of bars used for both the average and the standard deviation.
- Multiplier
- 2
- The width of the band in standard deviations. A larger value gives a wider band that price leaves less often.
Limits and points to note
- A close outside the band shows that the move was large compared with the recent spread. It does not show whether the move will continue or reverse.
- After a sharp move the standard deviation stays high for up to 20 bars, so the band can remain wide after price has calmed down.
- A very narrow band marks a quiet period; it does not show which direction the next move will take.
- Only closing prices are used. Wicks above or below the band are not part of the calculation.
Deviation Band her barda tek bir soruyu cevaplar: fiyat son ortalamasından, olağan hareket genişliğine göre ne kadar uzaklaştı? Bant fiyat dalgalandıkça genişler, durulunca daralır; bu yüzden ortalamadan aynı uzaklık sakin bir piyasada büyük, hareketli bir piyasada olağan sayılır.
Nasıl çalışır
Orta çizgi, son 20 kapanışın basit hareketli ortalamasıdır. Üst ve alt çizgiler bu ortalamanın iki standart sapma üstüne ve altına konur. Standart sapma, aynı 20 kapanışın ortalamanın çevresinde ne kadar geniş dağıldığını ölçer.
Genişlik fiyatın kendisinden geldiği için bant sabit bir yüzdeye ihtiyaç duymaz. Fiyat dar bir aralıkta hareket ettiğinde kapanışlar ortalamaya yakın durur ve bant daralır; ani bir hareket kapanışları dağıtır ve bant birkaç bar içinde açılır.
Fiyatlar ortalamanın çevresinde düzgün dağılsaydı kapanışların yaklaşık %95'i iki sapmalık bandın içinde kalırdı. Kripto fiyatları sıçramalarla hareket ettiği için uygulamada daha fazla kapanış dışarıda kalır: BTCUSDT 4 saatlikte son 1.000 kapanışın 131'i iki çizgiden birinin dışında gerçekleşti.
Grafiği okuma
Aşağıdaki bir maddenin üzerine geldiğinizde grafikte öne çıkar.
- Mavi çizgi: bandın ortası, 20 barlık basit ortalama.
- Turuncu çizgi: üst kenar, ortalamanın iki standart sapma üstü.
- Yeşil çizgi: alt kenar, ortalamanın iki standart sapma altı.
Ayarlar
- Length
- 20
- Hem ortalama hem standart sapma için kullanılan bar sayısı.
- Multiplier
- 2
- Bandın standart sapma cinsinden genişliği. Daha büyük değer, fiyatın daha seyrek dışına çıktığı daha geniş bir bant verir.
Sınırlar ve dikkat edilecekler
- Bandın dışındaki bir kapanış, hareketin son dağılıma göre büyük olduğunu gösterir. Hareketin süreceğini ya da döneceğini göstermez.
- Sert bir hareketten sonra standart sapma 20 bara kadar yüksek kalır; bu yüzden fiyat durulduktan sonra da bant bir süre geniş kalabilir.
- Çok dar bir bant sakin bir dönemi gösterir; bir sonraki hareketin yönünü göstermez.
- Yalnız kapanış fiyatları kullanılır. Bandın üstünde ya da altında kalan fitiller hesaba girmez.
indicator("Deviation Band", overlay = true)len = input.int(20, "Length")mult = input.float(2.0, "Multiplier")basis = sma(close, len)dev = mult * stdev(close, len)plot(basis, "Basis")plot(basis + dev, "Upper")plot(basis - dev, "Lower")
indicator("Deviation Band", overlay = true)len = input.int(20, "Length")mult = input.float(2.0, "Multiplier")basis = sma(close, len)dev = mult * stdev(close, len)plot(basis, "Basis")plot(basis + dev, "Upper")plot(basis - dev, "Lower")
Version 119 Oct 2026Latest
First release
There are no community posts about this indicator yet. You can write the first post about it.